Ariadne – a new chapter for Modell Aachen and orgavision!
Discover Ariadne


Your goal in process management is clear: reduce interface losses to an absolute minimum—ideally, eliminate them entirely. That’s why you need to challenge and improve processes systematically on a regular basis. One particularly effective method for this is the Process Structure Matrix (PSM).
Its biggest advantage: it brings all relevant aspects of a process onto a single page in a very clear way. That makes it an excellent tool to make interfaces visible—and improve them deliberately. Even better: it works regardless of the medium. You can build it in Excel, with sticky notes, or simply keep it as a mental model in the back of your mind.
I first came across the PSM in 2006 in the context of RWTH Aachen. Its exact origin isn’t clearly documented—but whenever I introduce the method, it reliably sparks interest. Because it helps you visualize individual process steps and, more importantly, the information flows between them. And that’s usually where the real weaknesses sit: information is missing, wrong, or outdated.
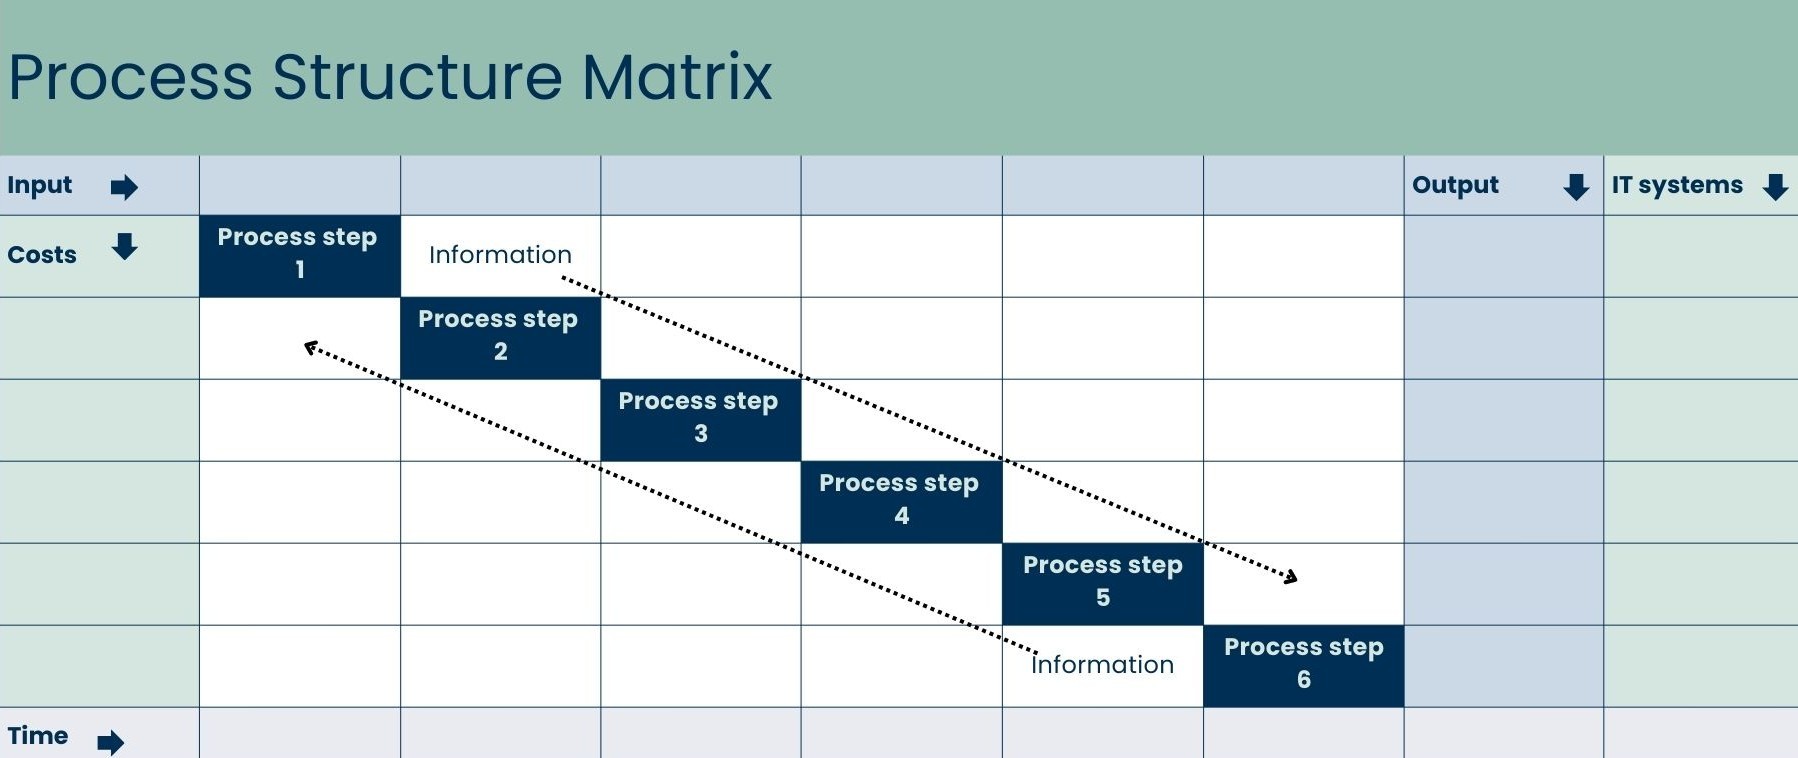
Step 1: Define the process steps
Choose a process chain with a clear start and end point.
List the individual process steps on the diagonal from top left to bottom right.
Step 2: Document the information flows
Above the diagonal, add forward information flows: What information flows from step A to step B?
Below the diagonal, add feedback flows: What information flows from step B back to step A?
Step 3: Add external inputs and outputs
In the header row, collect external inputs—such as requirements, templates, or data sources—that originate outside the process chain.
In the last column, collect the relevant outputs for other processes.
Step 4: Make responsibility visible
Mark every handover of responsibility between roles within the corresponding row.
Try to keep responsibility with one role for as long as possible to reduce handovers and avoid “responsibility zig-zagging.”
Step 5: Identify system breaks
On the right-hand side, list the IT systems used in each process step.
Minimize system changes—or, where it’s economically reasonable, build clean interfaces that transfer information automatically.
Step 6: Add time data
In the lower area, capture for each step:
The difference gives you waiting and idle times—often the hidden drivers that inflate lead time without adding value.
Step 7: Estimate cost per run
Calculate process cost per run based on:
Add these on the left side of the matrix.
If some steps don’t occur in every run, work with probabilities.
Repeat the calculation regularly so you can measure change over time.
The 6 root causes of process problems—and how the PSM helps you find them
It’s surprisingly consistent: most process problems can be traced back to just six root causes. You can identify and tackle many of them using the PSM.
1) You don’t know your internal customer’s expectations
Especially in larger organizations, processes generate a lot of information. But people rarely check systematically who actually needs which information—and in what format. The result: wasted effort, or missed opportunities because the internal customer could process the information far better in a different form.
→ You’ll spot these issues in the horizontal row to the left and right of the process step you’re analyzing.
2) Your internal supplier delivers incorrect or incomplete results
Many processes are inefficient (or break entirely) because the output of earlier steps can’t be processed directly—rework becomes the norm.
→ You’ll spot these weaknesses in the vertical column above and below the step you’re analyzing.
3) The tools don’t fit
Often the right infrastructure is missing to execute a process effectively and efficiently.
→ This is where the IT section on the right becomes especially valuable: the PSM makes system breaks and media changes visible at a glance.
4) The employee isn’t allowed to
Someone wants to act in a goal-oriented way—but isn’t authorized to. That’s a role and responsibility issue.
→ You’ll often recognize this through frequent role changes and unclear responsibilities in the top view.
5) The employee doesn’t want to
Sometimes a process slows down because someone is demotivated.
→ The PSM won’t show this clearly, because motivation isn’t part of the process structure.
6) The employee can’t
This doesn’t mean tools are missing—it means capability is missing.
→ The PSM is also limited here, because competence gaps require other types of analysis.
A strong mental model for systematically challenging processes
The Process Structure Matrix isn’t a magic solution that automatically fixes everything. But it does structure the core challenges of process management in a way that lets you recognize root causes quickly and clearly.
And you don’t even have to apply it formally every time. As a mental model, it’s extremely useful for keeping your process thinking sharp.
So: download the PSM Excel template and practice using it until the patterns become second nature in your day-to-day work. Good luck optimizing your processes.
Sign in to get in touch with Carsten directly.


We are happy to provide you with inspiring content, current events and news.


.jpg)


